Home › Propagation
Propagation
What the sun is doing, how high the ionosphere is reflecting right now and which bands are open as a result. Worked out from measurements by NOAA, GFZ and the ionosondes at GIRO, refreshed every 15 minutes, and cross-checked against what RBN and PSK Reporter actually hear.
Conditions at a glance
loading
MUF map
The highest frequency a 3000 km hop supports right now. It's based on a model of sun position and solar flux, with the ionosonde measurements (dots) on top. The further a sonde is away, the paler the area: there it's only calculated. Click a sonde to see its values and the last 48 hours.
Bands today
Is the band open from Germany in at least one direction, over a hop of 3000 to 4000 km? Worked out from the MUF on those paths as the ionosondes measured it at each time of day, D-layer absorption and the K index. The rule is under Explained.
| Band | by day | at night | now |
|---|
VHF
| What | Europe | Basis |
|---|
Sporadic E from the foEs of ionosondes in Europe (last hour, highest value), aurora from the Kp index and the auroral oval over northern Europe.
Measured: what's open now
The cross-check for the rating above. How many RBN and PSK Reporter receivers have heard stations from Germany (or Europe) in the last 30 minutes, by band and continent. Want to check yourself: Who hears me.
History and outlook
Solar flux, K index and MUF over Germany looking back, the nearby ionosondes over two days and what NOAA expects for the coming days.
Sun and solar wind
X-ray flares disrupt HF on the daylight side straight away; solar wind with a southward Bz disturbs the geomagnetic field one to three days later.
Active regions
Embed on your site
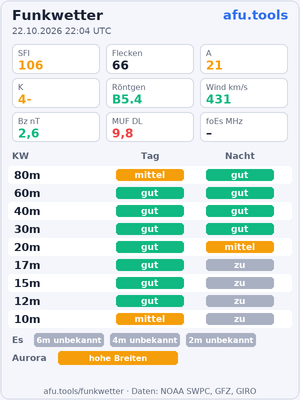
Propagation conditions as an image for your club site, forum or homepage. It refreshes itself every 15 minutes. Please don't download and re-upload it, keep it linked, or it stays out of date. None of our code runs on your site and there are no cookies.
Explained briefly
What the numbers mean and how this page rates the bands from them. The terms are also in the glossary under propagation.
The key figures
Solar flux (SFI) is the sun's radio emission at 10.7 cm, measured in Penticton (Canada). It tracks the UV radiation that ionises the F layer: around 70 is the doldrums, above 150 10 and 12 m open reliably by day.
K and A index tell you how disturbed the geomagnetic field is, K per three hours (0 to 9), A as a daily figure. Shown here is the official Kp from GFZ Potsdam. From Kp 5 it's a storm: the F layer thins out, northern paths drop out, aurora reaches further south.
X-ray flux from the GOES satellites, grouped into flare classes A, B, C, M, X. From M upwards the D layer swallows HF on the daylight side for minutes to hours (Dellinger fade-out). The D-RAP layer of the map shows how far that reaches.
Solar wind and Bz: when it's fast (over 500 km/s) with a southward Bz (negative), it couples into the geomagnetic field and a storm often follows.
Ionosondes and MUF
An ionosonde transmits straight up and measures the highest frequency the F2 layer reflects (foF2). From that follows the MUF(3000): the highest frequency a 3000 km hop still supports, roughly three times foF2. The sondes at GIRO report every 5 to 15 minutes; in Europe these include Juliusruh, Průhonice, Dourbes and Chilton.
foEs is the same for sporadic E clouds. From foEs 10 MHz 6 m opens over about 2000 km, from 14 MHz 4 m, from 29 MHz even 2 m.
How we calculate
The map: a model from sun position and solar flux, then for each sonde the ratio of measurement to model, weighted by distance (around 1200 km) and age (around 90 minutes).
The bands: the MUF directly over Germany isn't enough. At night it's often below 9 MHz, and yet 30 and 20 m still reach overseas, because the paths run via midpoints further south or west, where it gets dark later. So we take the midpoints of hops over 3000 and 4000 km in eight directions, calculate the model there for every hour (by day 9 to 15 h, at night 20 to 4 h) and correct it with what the sondes around Germany measured at that local time over the last 24 hours. The best path counts. If a band is below 85 % of that MUF it's good, up to 100 % fair, up to 115 % poor (scatter and short openings only), above that closed. At the bottom absorption sets the limit: below the LUF poor, just above it fair at best. From Kp 5 one step lower, from Kp 7 two.
This is a forecast for typical paths, not a measurement of your antenna. That's why what RBN and PSK Reporter are really hearing sits right next to it.
Data: NOAA Space Weather Prediction Center (public domain): solar flux, sunspots, regions, X-rays, solar wind, D-RAP, aurora, forecasts · GFZ Helmholtz Centre for Geosciences, Kp and ap (CC BY 4.0) · Ionosondes: GIRO, Lowell GIRO Data Center (CC BY-NC-SA 4.0), Reinisch & Galkin (2011), Earth Planets Space 63, 377-381, with thanks to the sonde operators (named in each sonde's popup) · measured openings: Reverse Beacon Network and PSK Reporter · Map: Natural Earth (public domain). Rating and map: afu.tools.